Alle Unterlagen für deinen Unterricht an einem Ort
Eduskript sammelt deine Unterrichtsskripts auf einer übersichtlichen Website – von Text und Video bis Live-Code, GeoGebra und Simulationen. Du präsentierst direkt im Browser, deine Klasse arbeitet direkt auf der Seite.
Gemacht für 
Alle Fächer
- Quizfragen mit Auto-Korrektur und Klassenübersicht
- Prüfungen und Unterricht im Safe-Exam-Browser
- KI-Feedback auf Handschrift
- Bild, Video, Präsentation
- KI-Hilfe beim Schreiben/Editieren
- Eigene interaktive Plugins und über 100 PhET-Simulationen
Mathematik
- KI-Feedback auf Lösungswege
- Funktionsplotter
- GeoGebra mit Klassenübersicht
- PhET-Simulationen, z.B. Ableitung und Integral
- LaTeX
Physik
- KI-Feedback auf Kräftebilder und Rechnungen
- Labor zur schiefen Ebene mit Kraftvektoren
- PhET-Simulationen, z.B. Wurfbewegung
- v-t-Diagramme und Plots direkt im Text
Chemie
- Strukturformeln ab SMILES
- Reaktionsgleichungen mit mhchem-Paket (
\ce{...}) - KI-Auswertung auf Zeichnungsaufgaben
- PhET-Simulationen, z.B. Reaktionsgleichungen ausgleichen
Informatik
- Python mit Turtle, SQLite, Javascript direkt im Browser
- Auto-Check von Code und SQL-Abfragen
- Interaktive Plugins zu Barcode, RGB, Dijkstra, Kryptografie
Probier AI-Feedback direkt aus
Dies ist ein Beispiel für Aufgaben, die du für deine Schülerinnen und Schüler erstellen könntest.
Öffne die Stift-Werkzeugleiste am unteren Bildschirmrand, wähle einen Stift und:
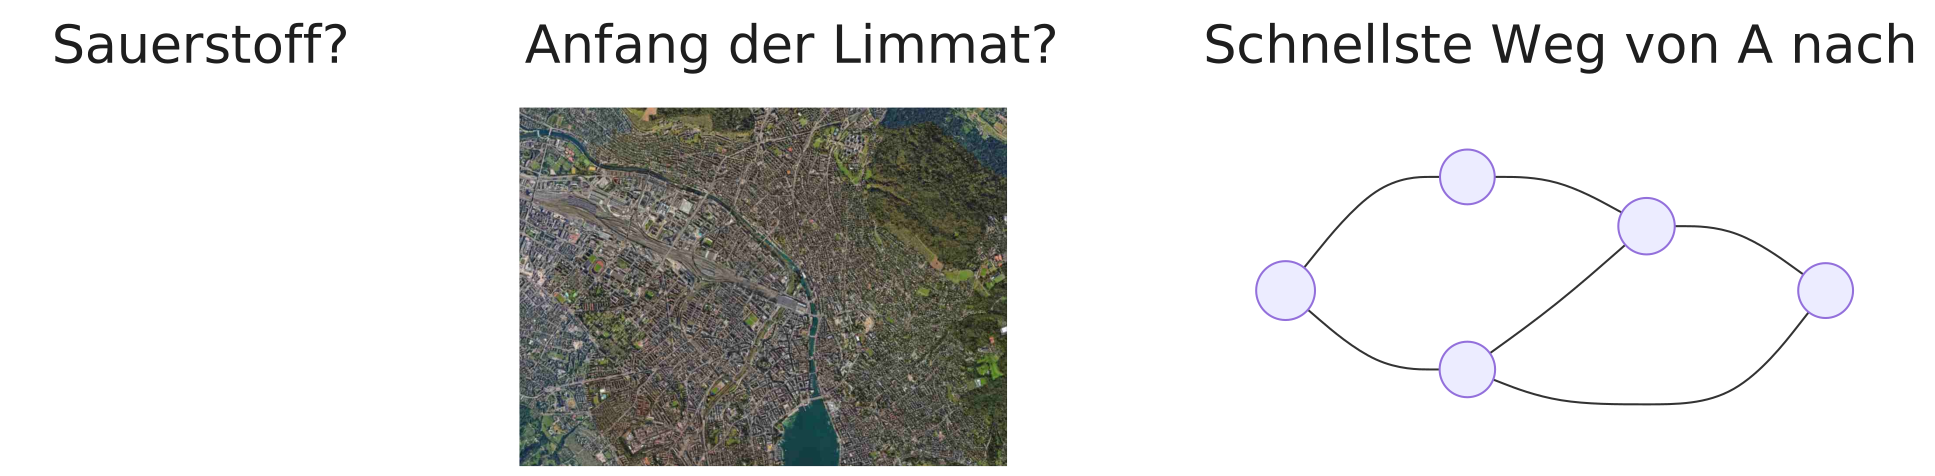
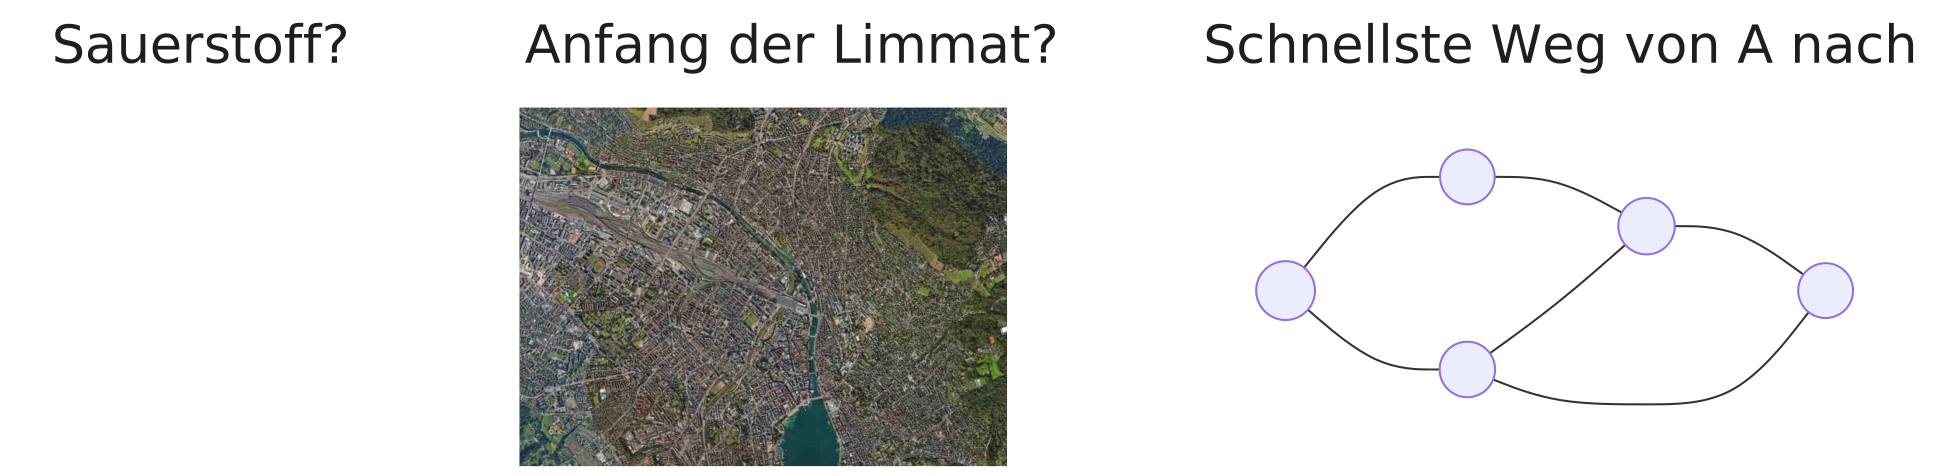
- kreise das Sauerstoffatom im Ethanol ein
- Markiere den Anfang der Limmat in Zürich
- Zeichne den schnellsten Weg von A nach E nach
Drücke dann auf Meine Zeichnung prüfen.
Die Klammern ausmultiplizieren
Dasselbe funktioniert mit gewöhnlicher Handschrift. Schreibe das Ausmultiplizieren von von Hand mit dem Stift in das Feld unten. Drücke dann Meine Arbeit prüfen. Die KI liest deine Handschrift, prüft jeden Schritt und weist auf den ersten Fehler hin, ohne die Antwort zu verraten.
Ein Quiz, das sich selbst bewertet
Eine Schätzung mit Toleranz
Drei Versuche. Nach einem falschen bekommst du einen Hinweis, nicht die Antwort.
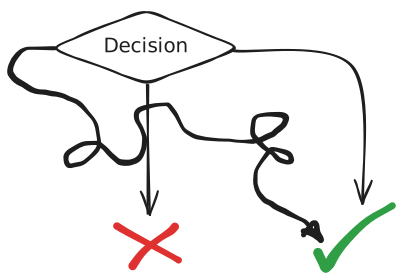
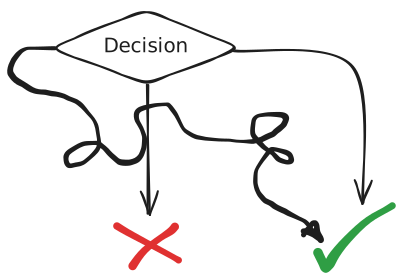
Skizzen
Handgezeichnete Diagramme mit dem eingebauten Skizzenwerkzeug. Hell- und Dunkelmodus inklusive.
Annotationen
Du kannst markieren, klar. Aber Schülerinnen und Schüler schreiben auch mit dem Stift auf jede Seite, und eine KI kann prüfen, was sie von Hand geschrieben haben.
Automatische Prüfung
Quiz, Schieberegler, vorhergesagte Ausgaben, Code, GeoGebra-Konstruktionen. Sofortiges Feedback für die Schüler, eine Klassenübersicht für dich.
Prüfungen
Dieselbe Seite im Prüfungsmodus: stille Bewertung, Etappen, die die Schüler nacheinander abgeben, Punkte, die du vor der Rückgabe anpassen kannst.
Folien
Jede Seite ist auch eine Präsentation. Projiziere sie im Unterricht, verteile danach dieselbe Seite.
Wie schreibe ich eine Lektion?
Eine Lektion ist ein Textdokument, und du bist die Lehrperson, nicht der Webdesigner. Keine Block-Menüs, keine Formulare, kein Zurechtklicken. Eine Überschrift, eine Liste, eine Formel, ein Quiz: Du tippst es, und die Seite wird beim Tippen gerendert. Wenn du in Word schon Überschriftenformate benutzt hast, weisst du genug, um anzufangen.
Bearbeite die linke Seite und schau rechts zu.
Schreiben mit KI
Die KI kann deine Inhalte erstellen, bearbeiten und anpassen. Oder nutze dein bestehendes Claude- oder ChatGPT-Abo via MCP.
Zusammenarbeit
Lehrpersonen können Skripts gemeinsam verfassen oder das veröffentlichte Material anderer forken, unter CC-BY-SA (Autor nennen, unter gleichen Bedingungen weitergeben).
Datenschutz
Du siehst den Fortschritt und die Prüfungen deiner Klasse. Der Server kennt deine Schülerinnen und Schüler nur unter Pseudonym, ohne Namen und ohne E-Mail-Adresse.
Schülerdaten bleiben pseudonym
Bei Eduskript ist das kein Schalter in den Einstellungen, sondern so gebaut.
Keine E-Mail-Adressen. Beim Login mit dem Schulkonto berechnet Eduskript aus der E-Mail-Adresse ein Pseudonym und verwirft die Adresse. In der Datenbank steht nicht, wer hinter einem Konto steckt.
Die Zuordnung liegt bei dir. Die Liste, mit der du Pseudonyme deinen Schülerinnen und Schülern zuordnest, liegt nur in deinem Browser. Du erkennst deine Klasse, der Server nicht.
KI in der Schweiz. KI-Feedback und KI-Korrektur laufen bei Infomaniak in der Schweiz. Sie erhalten nur Aufgabe und Lösung, nie Namen oder IDs, und nichts wird gespeichert oder zum Training verwendet.
Datenbank, Dateien und KI für Schülerdaten liegen in der Schweiz. Für Schulen gibt es eine Vorlage für den Auftragsbearbeitungsvertrag nach dem Muster des Kantons Zürich.
Datenschutzerklärung Für Schulleitung und ICT
Sieh es in Aktion
informatikgarten.ch ist ein vollständiger Informatik-Lehrgang, den eine Lehrperson auf Eduskript aufgebaut hat: Programmieren mit Python und Turtle, Barcodes, SQL-Datenbanken, Netzwerke, Kryptografie und mehr.
Was kostet Eduskript?
Eduskript ist open source und der Quellcode frei verfügbar auf Github. Wer keinen eigenen Server betreiben will, kann auf eduskript.org ein Konto erstellen: